Why is evolutionary history rarely considered in actual conservation planning? Well, there are many reasons. Conservation practitioners might not be aware that evolutionary diversity can be used in conservation. If they are aware, maybe it doesn’t compete with the vast number of other conservation concerns. Or maybe they do value it, and would like to use it, but are not sure how.
We have a new paper out in PhilTransRocSocB that addresses this last problem. We show how to use phylogenetic diversity in spatial prioritisation software. The advantage of using this software is that diversity can be considered alongside other concerns–extinction risk, connectivity, cost etc.
What do you need to do this?
1-distribution data (occurrence in grids or a species distribution model-SDM)
2-a phylogeny
How does it work? The spatial prioritisation is based on branches of the phylogeny rather than on species, which are typically used. We used Zonation software to set priority areas for eucalypts in Victoria, Australia (about 100 species that dominate forests across the state). We tried different scenarios: an optimal scenario, a hypothetical protected area expansion, and a recent change in protected area status.

An interesting result is that if we increased protected areas by 5% (which is <1% of the state area), we could increase phylogenetic diversity of eucalypts by 33% (see the dark red blocks in the figure).
This figure also shows some other useful numbers. There is a large difference between what is actually protected and what could be protected (the y-axis difference between the dashed and dotted lines).
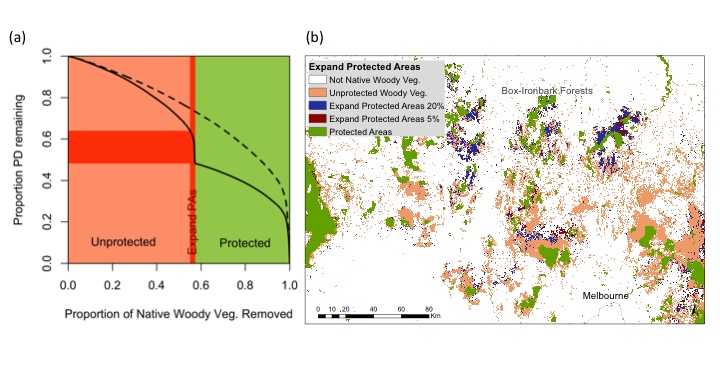
Where are the locations that correspond to large PD gains? The map shows the best places to expand the protected area system to capture the most eucalypt phylogenetic diversity.
The other way we can visualise this is on the phylogeny itself.
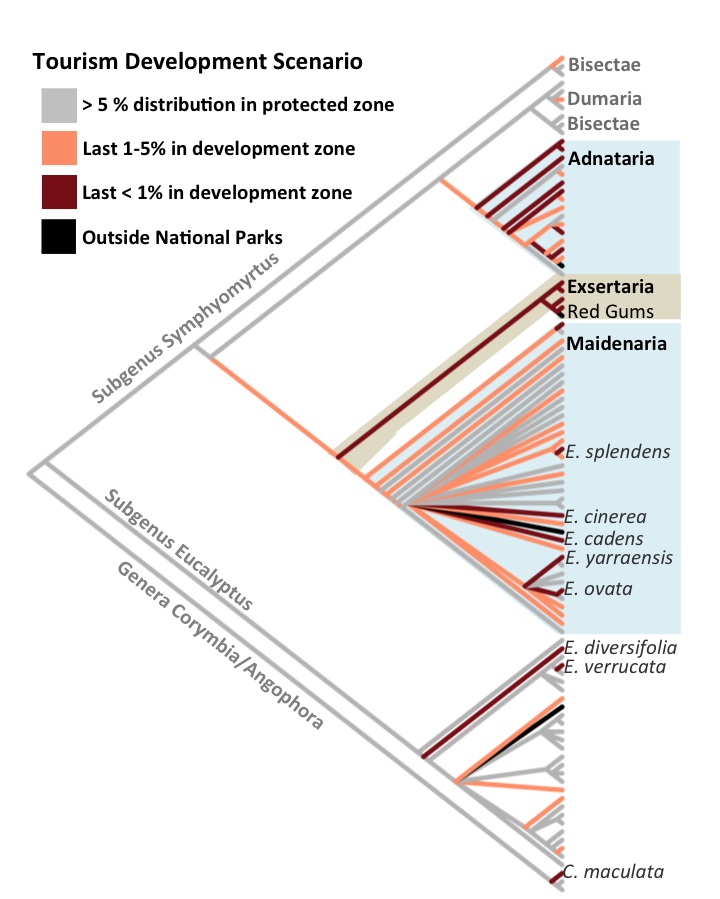
Some parts of the phylogeny are much more vulnerable to a change in the National Park System than others. Particularly the Red Gum group.
For more, see the paper:
And some other work that similarly use branches rather than species in a spatial prioritisation:
Using Zonation to prioritise fish species in southwestern USA..
And, very recently, using Marxan for stygofauna in aquifers. A great example on why using phylogenetic branches might be the best solution for those cases when many taxa are unknown.
Another approach in spatial prioritisation is to weight species by their evolutionary distinctiveness (ED), which gives the evolutionary contribution of each species. Mathematically, this is different than prioritising for PD. See Faith 2008 for a good explanation.
However, in practice, weighting species by ED and range-based ED captured much of the PD for global birds (Jetz et al. 2014).
