 The world’s biodiversity is in crisis. Species are declining at an alarming rate. And this is happening at just the time we are really beginning to understand this diversity through an unprecedented cataloging and compiling of information. Data repositories are filled with hundreds of thousands of entries about species, where they live, how they live, and who they are related to. And this is only the beginning. New DNA-based surveys are exploding onto the scene and our ideas and understanding of biodiversity are improving everyday.
So when and how do we use this burgeoning knowledge of biodiversity in biodiversity conservation?
We take a stab at this question in our recent paper out in Nature by analysing the world’s bird and mammal diversity from a conservation perspective. We ask how much of the world’s bird and mammal diversity is currently protected and how much better we could do if protected areas were to be expanded. We consider diversity to be not only species, but also phylogenetic and functional diversity. The use of these types of diversity means we have a better chance of meeting big policy goals of preserving biodiversity that benefits humans and ecosystems than with a sole focus on species.
We find that about a quarter of species are not represented in protected areas (according to a threshold for protection, see paper for details). Just over 10% of the phylogenetic branches are unrepresented for birds and twice that for mammals. Most of the phylogenetic branches and functional units have less than 10% of their spatial distribution found in protection (see fig below for an example with the bird tree of life or fig. 2 in the paper for the full set of results).
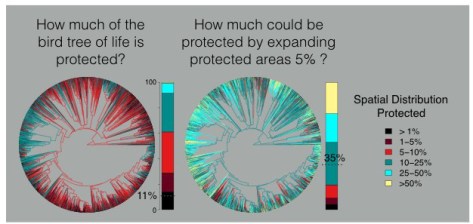
However, this situation could potentially be vastly improved. Spatial representation (the % of the protected spatial distribution) of species, phylogenetic or functional units could be doubled by expanding protection by 1% (of the land area) or tripled with a 5% expansion.
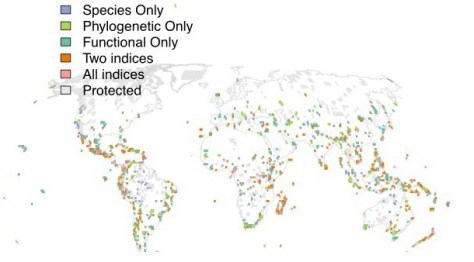
What’s more is that many areas are important for not only one, but two or even all three types of diversity or for both animal groups.
We go on to explore a number of issues such as how conservation objectives align with diversity metrics and ways of prioritising, and deal with various types of uncertainty – functional, phylogenetic, different thresholds for protection.. and how using a prioritisation algorithm compares to selecting biodiversity hotspots etc.. Another post on all this to come..
Also, check out some pretty interactive maps of these results on the Map of Life!
